- Published on
Partisan Bias in Congressional District Maps
- Authors

- Name
- Kodi
- https://twitter.com
As is customary before the first set of congressional races in a new decade, the redrawing of congressional district maps is top of mind for politicians and attentive voters alike. This process, also known as redistricting, entails the delineation of new boundaries for each state's congressional districts in response to updated population data from the U.S. Census. As political party leanings can differ dramatically from region to region within a state, redistricting effectively shapes the electoral landscape with regard to House of Representatives races for the following 10 years. Consequently, the issue of who gets to do the redrawing is often a subject of contention. In most states, it is carried out by the state legislature, with the approval process usually conducted in a manner similar to that of regular legislation (i.e., approval from a simple majority in both chambers is required with the potential for gubernatorial veto). Evidently, this has the potential to give way to partisan gerrymandering, or the deliberate drawing of district boundaries such that one's political party is conferred an electoral advantage, especially in cases in which one party controls the state legislature and the governorship. To be sure, there are federal and state laws concerning redistricting, ensuring that the maps do not engage in racial or ethnic discrimination by way of restricting the voting power of minorities and sometimes requiring that maps be contiguous, compact, and/or respectful of the boundaries of cities, counties, and other communities whose members may share common interests. However, outside of these requirements, legislatures are largely free to draw congressional districts to their liking.
In order to eliminate this conflict of interest, some states instead entrust the task of redrawing their maps to independent or bipartisan commissions. Commissions may also be called on to carry out redistricting if the state legislature fails to agree on a final map drawing. State courts might intervene in the redistricting process as well by striking down legislature-drawn maps that are found to be unlawful, in which case the court will either order the legislature to draw a new map or draw a new one itself.
As commissions and courts generally share neither the partisan nature of state legislatures nor their direct incentive to draw electorally advantageous maps, some contend that each state should be required to adopt maps drawn by these institutions in order to curb the effects of partisan gerrymandering and lessen partisan bias in congressional district maps nationwide. However, while gerrymandering no doubt introduces some degree of bias, a state's prevailing demographic makeup and geography also have the potential to confer an organic electoral advantage to one party over the other. For instance, Republicans tend to be spread out in sparse, rural areas while Democrats are highly concentrated in dense, urban areas, an arrangement which lends itself to a greater number of majority-Republican districts without the need for wonky district boundaries. Consequently, some have also suggested that the district-based scheme be completely overhauled in favor of proportional representation, an electoral system in which the number of House seats a party is allocated for a given state is proportional to the party's overall share of votes in that state.
Regardless of the source, a party's electoral advantage in a House race manifests itself in overrepresentation on a district-by-district level as compared to the party's statewide popularity. For example, the district boundaries of a five-district state with 55% Democrats and 45% Republicans overall may result in four majority-Democrat districts and one-majority Republican district, or an 80% Democrat / 20% Republican House seat split. Therefore, one way to analyze congressional district maps is to determine the degree to which a state's district-by-district party makeup is out of sync with its statewide party makeup. With respect to a given state and House election, this can be determined by taking the difference between two metrics:
Statewide seat share - The amount of House seats won by each party, as a percentage of the state's districts
Statewide vote share - The amount of votes cast for each party, as a percentage of the state's total voting population
A seat share-vote share difference of 0 implies that the party makeup of the districts produced by the map is consistent with the overall party makeup of the state. If these numbers are inconsistent, the party for whom this difference is positive is the advantaged party (i.e., the district arrangement confers them more representation than they would otherwise have under a proportional representation system), and the difference is negative for the disadvantaged party.
Using election data concerning the last five House races (available on clerk.house.gov), we analyzed the maps drawn for the most recent redistricting cycle in this way, determining the seat share-vote share difference for the advantaged party in each state with more than one district. We also computed the number of seats that were won by that party as a result of this difference (i.e., the extra seats that the advantaged party won relative to the seats they would be allocated under proportional representation) by multiplying the seat share-vote share difference by the state's total number of seats.
| Year | Party | States Conferring Map Advantage | Average Seat Share-Vote Share Difference | Average Seats Won Due To Map Advantage | Total Seats Won Due To Map Advantage | Net Seat Gain |
|---|---|---|---|---|---|---|
| 2012 | D | 16 | 0.218 | 1.625 | 26 | |
| 2012 | R | 27 | 0.198 | 1.667 | 45 | 19 |
| 2014 | D | 14 | 0.202 | 1.786 | 25 | |
| 2014 | R | 29 | 0.195 | 1.448 | 42 | 17 |
| 2016 | D | 16 | 0.189 | 1.188 | 19 | |
| 2016 | R | 27 | 0.2 | 1.519 | 41 | 22 |
| 2018 | D | 20 | 0.203 | 1.7 | 34 | |
| 2018 | R | 23 | 0.222 | 1.652 | 38 | 4 |
| 2020 | D | 19 | 0.225 | 1.737 | 33 | |
| 2020 | R | 24 | 0.214 | 1.833 | 44 | 11 |
To assess the electoral impact of these seat share-vote share differences on the parties at large, we grouped the states by the parties that their district lines conferred an advantage to and computed a few relevant metrics (average seat share-vote share difference for each party, amount of extra seats won by each party, etc.), displayed in the table above. Using these metrics, we also determined how the results of each election would have changed if they were instead conducted under the proportional representation scheme, which is shown in the table below.
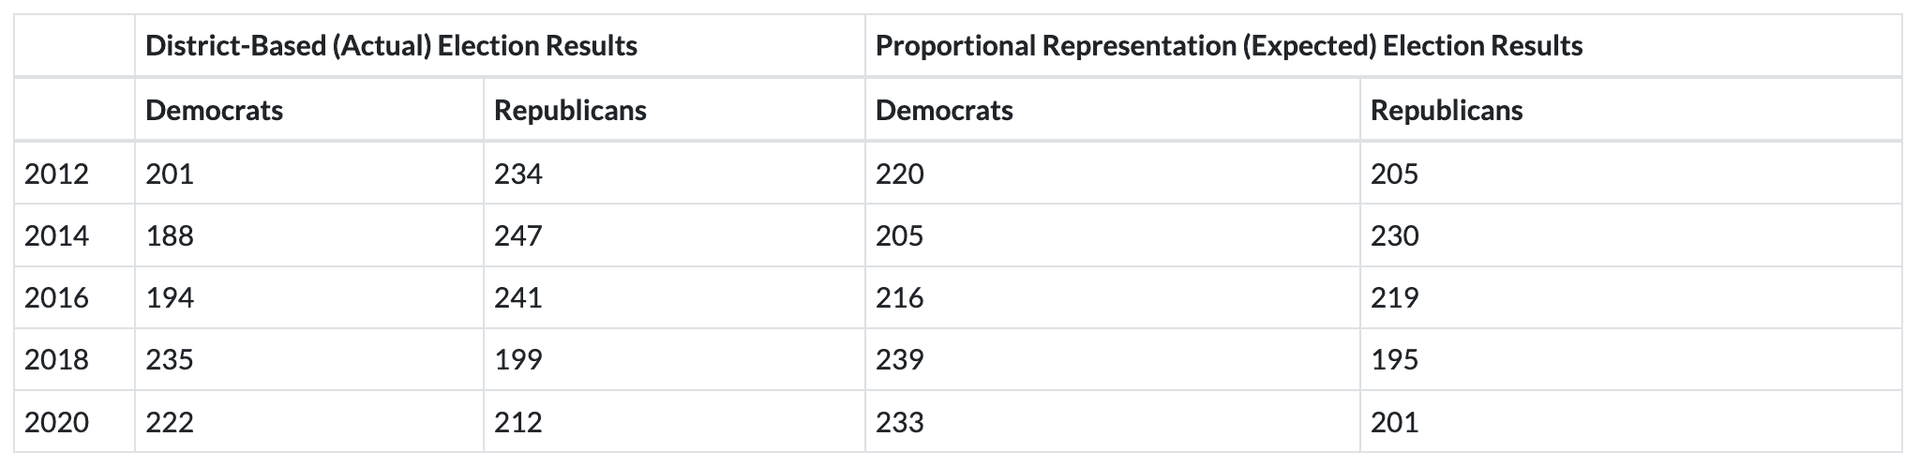
From the tables, we see that the average seat share-vote share difference and average number of extra seats won were essentially equal for both parties throughout the years. However, notably, we also find that the number of states in which Republicans were the advantaged party was greater than that of Democrat-biased states for every election year. As a result, the total number of extra seats gained tended to differ greatly between the parties, with the Republicans winning the net gain in seats during every election year. In other words, while congressional district maps tended to favor each party to the same degree, the Republicans consistently reaped the greater electoral benefit overall, earning more would-be Democrat seats than Democrats earned would-be Republican seats. In fact, we see that during the 2012 election, the Republican advantage was strong enough to give them a majority in what would have otherwise been a Democrat-controlled House.
As mentioned above, these seat share-vote share differences cannot wholly be attributed to partisan gerrymandering, and the degree to which gerrymandering plays a role is unclear. However, looking at the types of institutions that drew each map can provide some insight, as legislatures are much more likely to draw gerrymandered maps than courts or commissions. Consequently, we also pulled data from redistricting.lls.edu, which provides the institutions that drew each congressional district map used during the 2010-2020 cycle, as well as which party, if any, had unilateral control over each state's redistricting. Grouping the states by the broad types of institutions (commission, court, or legislature) that drew their maps for each election, we computed the average seat share-vote share differences across all of the elections for each institution type's maps, which are shown below.
| Map Drawn By | Average Seat Share-Vote Share Difference |
|---|---|
| Legislature | 0.226 |
| Commission | 0.18 |
| Court | 0.17 |
| Non-legislature (commission or court) | 0.174 |
We see that seat share-vote share differences for court- and commission-drawn maps tended to be smaller than those of maps drawn by legislatures, with seat shares and vote shares being about 20% to 25% closer to parity with the non-legislature-drawn maps. Conducting a Welch's t-test the results of which are shown in the table below, shows that the differences between these averages for legislature-drawn and non-legislature-drawn maps are all statistically significant, with a significance level of 0.05, suggesting that legislature-drawn maps did, in fact, tend to produce electoral results less representative of their states' total voting populations than their non-legislature counterparts. Furthermore, in 107 of the 132 elections that involved legislature-drawn maps, or 81.1% of the time, one party had unilateral control over the map-drawing process, and in 86 of those 107 elections, or 80.4% of the time, the party in control of the process ended up being the advantaged party. Taken all together, these statistics corroborate the notion that partisan gerrymandering plays a non-trivial role in producing congressional district maps that favor one party over the other. However, it's important to also note that the court- and commission-drawn maps were still not entirely unbiased; indeed, their average seat share-vote share differences were closer to that of the legislature-drawn maps than they were to parity. Given that these institutions largely lack an incentive to gerrymander, this suggests that the overall partiality of congressional district maps may be less attributable to gerrymandering than it is to the geographic and demographic disparities within states that lend themselves to reasonable district boundaries compliant with federal and state laws.
| Difference of means | p-value | |
|---|---|---|
| Legislature vs commission | 0.046 | 0.048 |
| Legislature vs. court | 0.056 | 0.003 |
| Legislature vs. non-legislature (commission or court) | 0.052 | 0.001 |
In the end, it's clear that with the district-based electoral system come congressional district maps with partisan biases, some largely intractable and others more artificial and amenable to regulation. If one's goal is to eliminate these biases and make House election results more reflective of the total voting population of each state, then a shift to a proportional representation system would certainly be the simplest and most effective way to do so. Within the constraints of the current system though, the imbalances created by geography and demography render complete map fairness elusive. However, partisan gerrymandering also plays a role in creating electorally lopsided maps, and if the 2010-2020 redistricting cycle is any indication, it seems that curtailing the incentive to gerrymander by delegating the map-drawing process to courts and commissions instead of state legislatures proves a viable, if limited, means of mitigating bias.
The code used to conduct this analysis is available on GitHub.