- Published on
The Effect of the Filibuster on Senate Output and Bipartisanship
- Authors

- Name
- Kodi
- https://twitter.com
With a 50-50 split in the Senate between Democrats and Republicans, many worry that the Democrats will be unable to enact key parts of President Biden's legislative agenda, despite having control of Congress and the White House, with one significant source of this worry being the Senate filibuster. Essentially, under current Senate rules, any senator can indefinitely delay the vote on most legislative actions by debating about them in perpetuity, or, since 1970, by at least threatening to do so. Currently, the only way to end a filibuster and bring the legislative action under question to a vote is to invoke cloture, which imposes a time limit on debate over the topic but typically requires at least 60 votes of all 100 senators, as opposed to the simple majority officially required for legislation to pass.
Critics of the filibuster argue that it primarily facilitates government gridlock and precludes the enactment of meaningful legislation. In other words, by allowing a minority of senators to block legislation that it finds unfavorable, the filibuster effectively disrupts the functioning of Congress and the government at large by preventing the majority from exercising the full extent of their legislative power. Conversely, proponents contend that even if some pieces of legislation fall through the cracks as a result of the filibuster, it is nevertheless useful for promoting bipartisanship and compromise. Essentially, the filibuster protects against the tyranny of the majority by preventing a simple majority in the Senate from forcing lopsided and potentially hyperpartisan legislation to passage. Instead, the legislation in question has to be popular enough to be supported by the country more broadly, which would manifest itself in the support of at least 60 senators, or its advocates must be willing to cooperate with and/or make accommodations for the malcontent minority, lest their proposed bills be filibustered.
Both of these notions are certainly valid in theory, but to see how things play out in practice and explore the true effects of the filibuster, we examined data available on senate.gov and congress.gov to see how the filibuster has been used throughout its history. Data concerning the total number of filibusters that occurred during a given Congress are unavailable, but the Senate provides the numbers of cloture motions that were filed, cloture votes that took place, and clotures invoked during each Congress. Additionally, for all Congresses since 1989 (Congresses 101 to 116), the roll call results of each cloture vote and their associated filibustered actions are available. It's unclear how common it is for senators to seek to invoke cloture for their filibustered actions, so we can't be certain that these metrics provide precise insight into filibuster usage, but they can still aid in providing a general sense of how the filibuster was used during each Congress.
In particular, using the results of each of the cloture votes, one can gauge and compare the degrees to which filibustering has contributed to obstruction and compromise with regard to bills. If the cloture motion for a bill fails to get 60 affirmative votes and is ultimately rejected without the bill ever being considered, then the bill has effectively been blocked as a result of the filibuster. On the other hand, if a bill's cloture motion is initially rejected but eventually agreed to in a later vote, it is likely a sign that the bill was amended to be more favorable to its initial detractors or a conciliatory deal was forged in order to secure the necessary votes, both of which are indicative of the filibuster fostering compromise within the Senate.
With this in mind, using only the cloture votes concerning bills and motions to proceed to the consideration of a bill, we found the number of unique bills filibustered during each of the 16 most recent Congresses and categorized them by the results of their cloture votes (i.e., initially invoked, ultimately blocked, or blocked and later considered). These values, as well as the total number of bills introduced in or brought to the Senate during each Congress, are displayed in the data table below.
| Congress | Bills Introduced | Filibustered Bills | Ultimately Blocked | Blocked and Later Considered | Cloture Initially Invoked |
|---|---|---|---|---|---|
| 101 | 3863 | 11 | 5 | 1 | 5 |
| 102 | 4006 | 24 | 9 | 2 | 13 |
| 103 | 3093 | 14 | 8 | 1 | 5 |
| 104 | 2689 | 16 | 10 | 0 | 6 |
| 105 | 3185 | 22 | 12 | 0 | 10 |
| 106 | 3995 | 26 | 12 | 1 | 13 |
| 107 | 3747 | 22 | 4 | 1 | 17 |
| 108 | 3653 | 17 | 9 | 2 | 6 |
| 109 | 4738 | 26 | 8 | 2 | 16 |
| 110 | 4684 | 50 | 22 | 4 | 24 |
| 111 | 4781 | 31 | 9 | 1 | 21 |
| 112 | 4207 | 34 | 14 | 1 | 19 |
| 113 | 3601 | 36 | 18 | 0 | 18 |
| 114 | 4321 | 32 | 18 | 6 | 8 |
| 115 | 4803 | 11 | 1 | 0 | 10 |
| 116 | 5863 | 19 | 10 | 1 | 8 |
From the data, we see that it is more likely for a filibustered bill to be blocked from consideration and stay blocked than it is for it to be eventually considered after initial blockage, with the latter usually occurring only once or twice per Congress, if at all. This suggests that to the degree that the filibuster has an effect on legislation, it seems to aid more in obstruction than it does in compromise. However, it is important to consider the filibuster in the bigger legislative picture. Particularly, if we assume that it is commonplace for senators to seek cloture for their filibustered bills, then the table above also suggests that the vast majority of bills introduced in or brought to the Senate tend not to be filibustered. Therefore, while the filibuster might have a greater tendency to block legislation than force a compromise, it seems to have an overall negligible impact on legislation with respect to the quantity of introduced bills directly affected by its use.
Although it provides us some insight into filibuster use, this analysis is flawed in a few ways. For instance, it is difficult to adequately account for the bills for which cloture was invoked on the first try. On one hand, it's possible that these cloture motions were initially fated to fail but compromises were reached before their votes took place that ensured their passage; on the other hand, these clotures might've merely been failed attempts to block legislation that was already broadly popular. In addition, this data does not account for filibustered bills for which a cloture motion was never filed or for cloture motions that were filed but were never brought to a vote, and therefore likely leads to an underestimation of the filibuster's effects, particularly with regard to obstruction. Finally, and perhaps most importantly, this analysis overlooks an indirect, but potentially more pervasive effect of the filibuster that is harder to quantify.
Specifically, while the filibuster itself may be relatively inconsequential, the prospect of a filibuster occurring could contribute significantly to bipartisanship and obstruction. For instance, in anticipation of their bills being filibustered, senators might take conciliatory measures to mitigate the risk of a filibuster before it can actually occur, such as drafting bills with the desires of both parties in mind, their provisions being the products of preemptive compromise. Alternatively, senators may decide to halt the progress of introduced bills and kill them prematurely if they feel that the bills are bound to be blocked by the filibuster otherwise (e.g., if failure seems imminent, party leaders may keep their party's bills off the legislative schedule, and committees may decide not to take action on or report to the Senate floor the bills that are referred to them).
Consequently, as a means of ascertaining the filibuster's effects beyond what can be gleaned from just the cloture votes, we also examined the relationships between the prevalence of filibuster use and bills that could be affected by the filibuster both directly and indirectly.
Filibuster prevalence aids in our analysis by serving as a proxy for the "prospect of a filibuster occurring", which itself is unquantifiable. Specifically, we assume that the more frequently the filibuster is used during a given Congress, the greater the likelihood of senators' bills being filibustered (at least as perceived by the senators). As a metric for filibuster prevalence, we computed the frequency with which cloture motions were filed during each Congress by dividing the number of cloture motions filed by the total number of legislative actions (bills, resolutions, nominations, etc.) introduced in or brought to the Senate.
In addition, considering all potentially influenced bills serves as a means of identifying both the explicit and implicit effects of the filibuster, as it allows us to account for filibustered bills that were either forced to a compromise or overtly blocked from a vote and non-filibustered bills that were either designed to be conciliatory and prevent a filibuster or preemptively tabled in anticipation of one. On the bipartisanship/compromise side, while there is no way to measure the degree to which a bill is bipartisan, there are some tangible aspects of bills that we expect to accompany bipartisanship, such as sponsorship by members of both parties or passage with broad support from both parties. Therefore, as two metrics of bipartisanship, we computed the proportion of bills introduced in the Senate that had at least one Democrat and one Republican cosponsor, which we refer to as the bipartisan cosponsorship rate, and the proportion of Senate-approved bills that passed with bipartisan approval (i.e., passed via voice vote or with "yea" votes from a majority of each party's members via roll call vote), or the bipartisan passage rate. On the obstruction side, a bill that has been blocked by the filibuster or otherwise killed by the proposing party will not receive a vote on the Senate floor; consequently, we computed the proportion of bills introduced in or brought to the Senate that received a floor vote, which we term Senate output, and use this as an indicator of obstruction.
| Congress | Cloture Frequency | Bipartisan Passage Rate | Bipartisan Cosponsorship Rate | Senate Output |
|---|---|---|---|---|
| 101 | 0.004 | 0.979 | 0.423 | 0.176 |
| 102 | 0.006 | 0.971 | 0.38 | 0.179 |
| 103 | 0.009 | 0.953 | 0.373 | 0.173 |
| 104 | 0.008 | 0.959 | 0.359 | 0.181 |
| 105 | 0.007 | 0.986 | 0.374 | 0.178 |
| 106 | 0.007 | 0.981 | 0.4 | 0.195 |
| 107 | 0.006 | 0.985 | 0.435 | 0.139 |
| 108 | 0.006 | 0.992 | 0.465 | 0.2 |
| 109 | 0.005 | 0.974 | 0.361 | 0.14 |
| 110 | 0.01 | 0.978 | 0.47 | 0.115 |
| 111 | 0.01 | 0.952 | 0.341 | 0.091 |
| 112 | 0.011 | 0.963 | 0.294 | 0.083 |
| 113 | 0.024 | 0.97 | 0.393 | 0.101 |
| 114 | 0.01 | 0.978 | 0.416 | 0.097 |
| 115 | 0.016 | 0.996 | 0.472 | 0.115 |
| 116 | 0.028 | 0.996 | 0.442 | 0.082 |
Consolidating all of this information for Congresses 101 to 116 gives the table above. From the table, we see that the frequency of cloture motion filings has increased over time, suggesting an upward trend in filibuster prevalence. Additionally, Senate output has decreased, shrinking by more than half over the past two decades, while bipartisan passage and cosponsorship show no clear upward or downward trend. Interestingly, we also see that introduced bills tend not to be considered, with the most efficient Senate voting on only 20% of legislation, but of the bills that are considered and approved by the Senate, the vast majority tend to pass with bipartisan support.
Using the data, we first explored the relationships between cloture frequency and bipartisan cosponsorship and passage rates, which are captured by the scatterplots below.
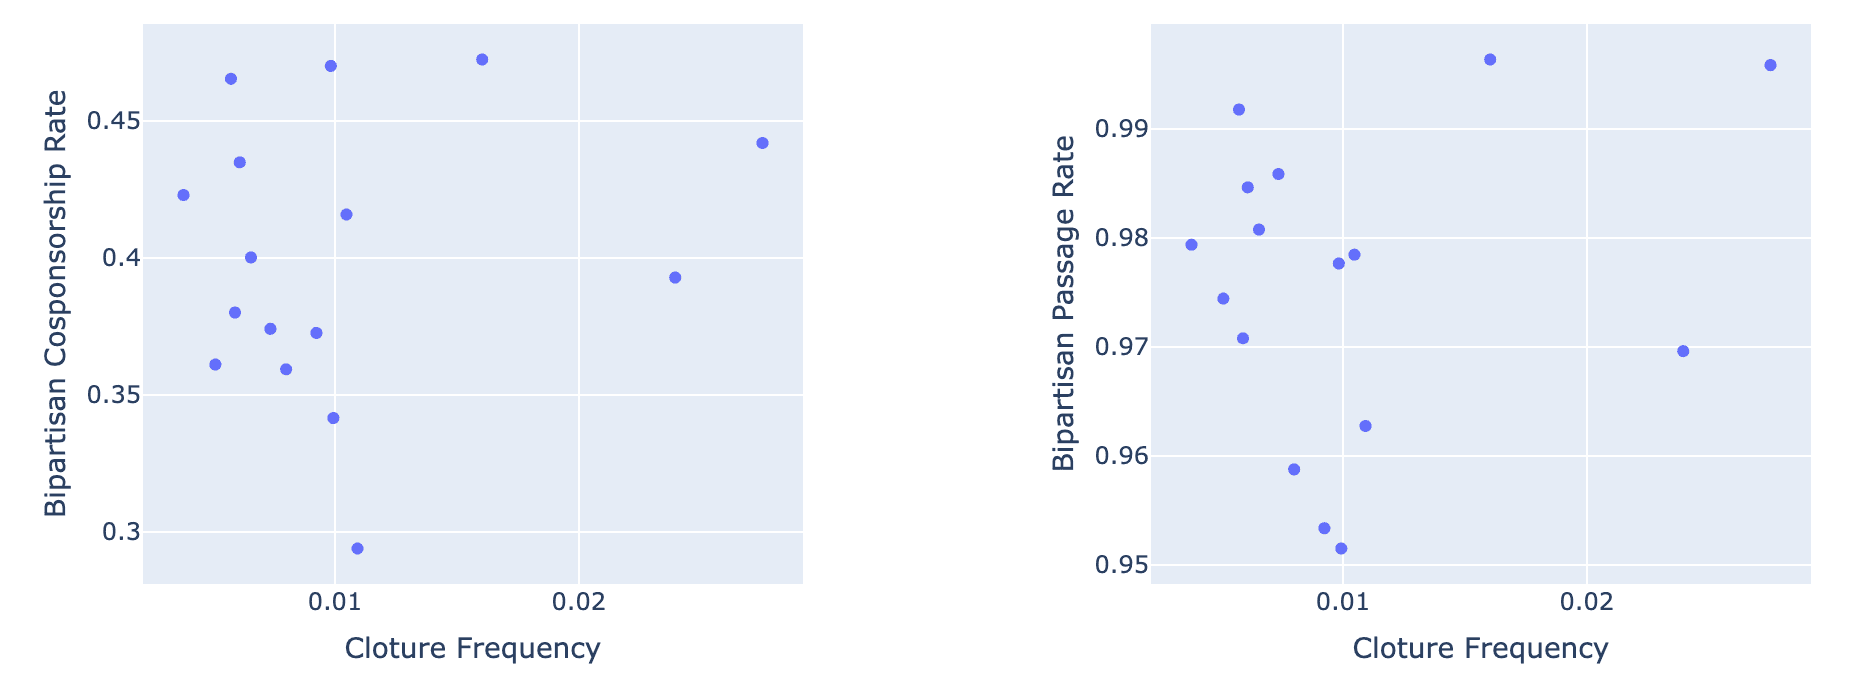
From inspection of the scatterplots, there doesn't seem to be a relationship between filibuster prevalence and bipartisanship with regard to either metric. The non-association becomes clear when considering the Pearson correlation coefficients between the variables, as well as their p-values, which are shown in the table below.
| R | p-value | ||
|---|---|---|---|
| Cloture Frequency | Bipartisan Cosponsorship Rate | 0.17 | 0.529 |
| Cloture Frequency | Bipartisan Passage Rate | 0.21 | 0.443 |
Specifically, we see that the magnitudes of the R values both indicate weak correlations, and using a significance level of 0.05, both of the p-values exceed the significance level, implying that there is no evidence of statistically significant relationships. In essence, using cosponsorship and passage rates as measures of bipartisanship, we do not see evidence of a relationship between filibuster prevalence and bipartisanship.
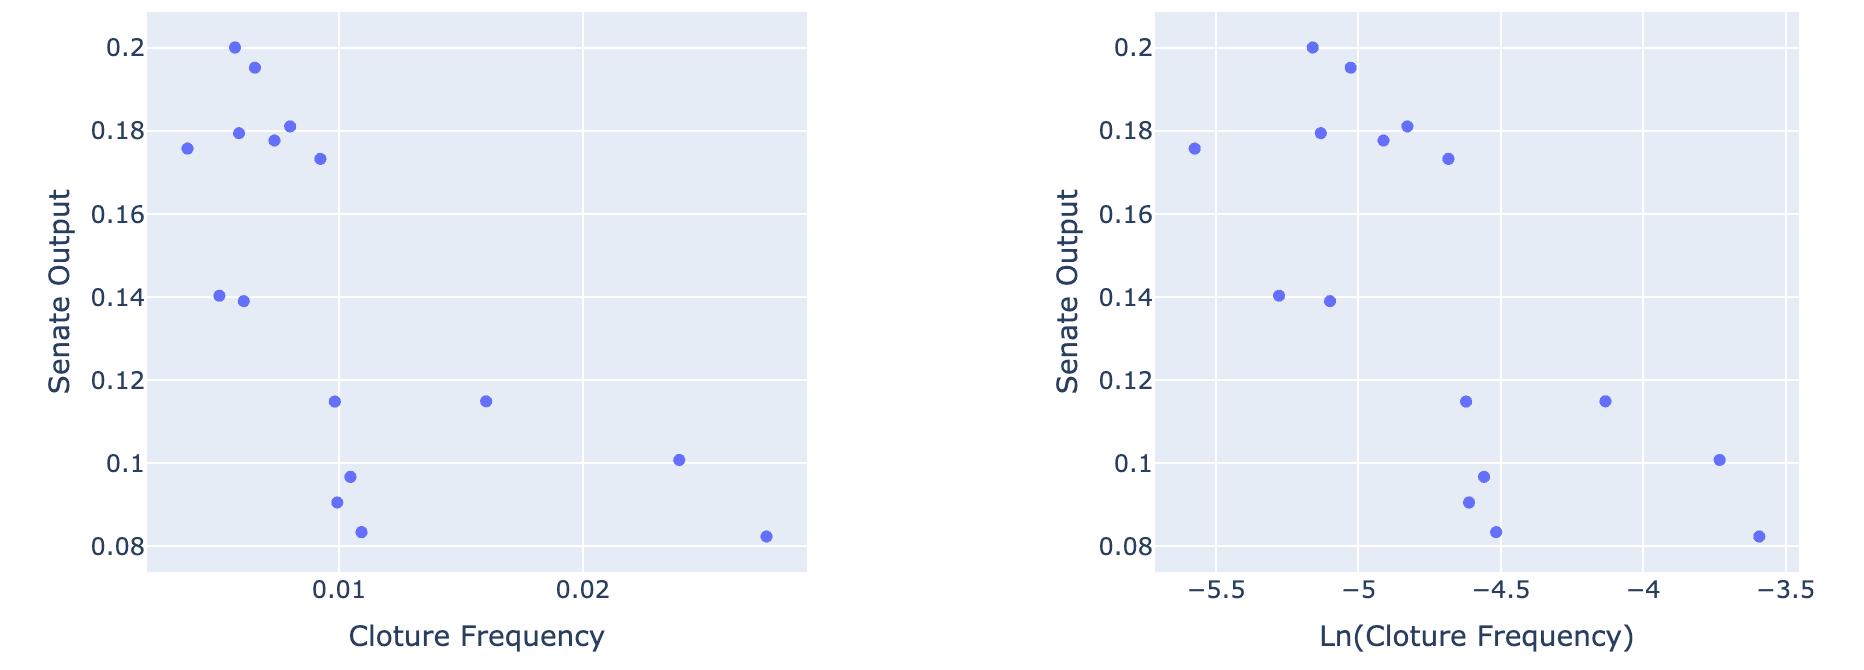
If we instead consider the relationship between cloture frequency and Senate output, we see a much more discernible trend. The scatterplot above on the left shows that output decreases exponentially as the frequency of cloture motion filings increases, with the percentage of bills receiving a floor vote plateauing at around nine percent. In order to make this relationship suitable for Pearson correlation analysis and quantify its strength, we also linearized it by taking the natural logarithm of the cloture frequencies and using the log-transformed values as the independent variable instead, as shown in the updated scatterplot above on the right.
From the table below, we see that Senate output has a strong, negative linear association with the log-transformed cloture frequency. Additionally, the p-value falls below the significance level of 0.05, implying that this correlation is statistically significant.
| R | p-value | ||
|---|---|---|---|
| Ln(Cloture Frequency) | Senate Output | -0.71 | 0.002 |
In order to model this relationship and further estimate the degree to which filibuster prevalence accompanies decreases in output, we also performed a linear regression, the results of which are displayed below.
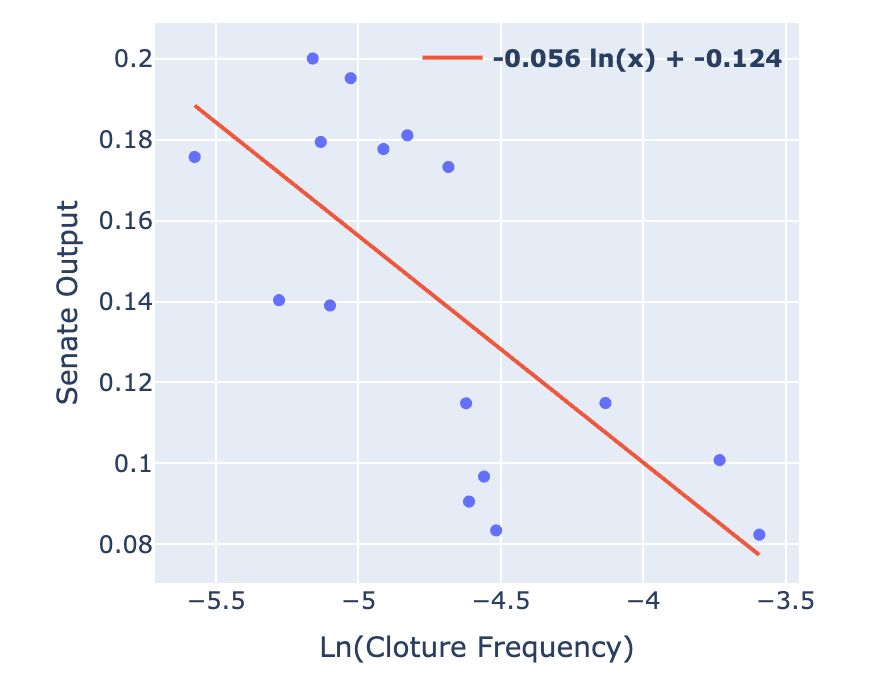
With a log-transformed independent variable and a coefficient of -0.056, the regression model predicts that the percentage of bills that receive a floor vote decreases by approximately one percentage point with every 20% increase in cloture frequency. Ultimately, we see that increased prevalence of the filibuster is associated with a marked reduction in the proportion of bills voted on by the Senate.
Overall, there is no evidence of a relationship between filibuster prevalence and bipartisan passage or cosponsorship, but we do see a negative association between filibuster use and the Senate's legislative output, suggesting that the filibuster may give rise to obstruction beyond what is displayed by the cloture votes.
In order to arrive at an explanation behind these results, it will be helpful to first consider the lopsided nature of the obstructing effects we see. Namely, while any senator(s) can theoretically filibuster most legislation regardless of party affiliation, more often than not, the legislation under threat is actually legislation proposed by the majority party of the Senate, its fate lying in the hands of members of the minority party. This may strike some as a foregone conclusion, given the fact that the majority party typically already has the votes to curb legislation that goes against its interests sans filibuster, thus making the filibuster more useful to the minority party and rendering majority party legislation more susceptible to its use. In order to confirm this notion, however, we can consult the data.
Looking deeper into direct filibuster use, we see from the table below that majority party legislation (i.e., bills for which the primary sponsor is a member of the majority party) makes up the lion's share of filibustered bills for each Congress. Additionally, votes to invoke cloture for these bills tend to be opposed primarily by the minority party (i.e., members of the minority party make up the majority of "nay" votes). Therefore, as far as bills are concerned, the filibuster is mostly used by the minority party as a means of blocking legislation from the majority party.
| Congress | Filibustered Bills | Majority Party Bills | Majority Party Bills Opposed by Minority Party | Minority Party Bills |
|---|---|---|---|---|
| 101 | 11 | 11 | 9 | 0 |
| 102 | 24 | 22 | 19 | 2 |
| 103 | 14 | 14 | 13 | 0 |
| 104 | 16 | 16 | 13 | 0 |
| 105 | 22 | 21 | 14 | 1 |
| 106 | 26 | 25 | 16 | 1 |
| 107 | 22 | 12 | 4 | 10 |
| 108 | 17 | 17 | 15 | 0 |
| 109 | 26 | 25 | 16 | 1 |
| 110 | 50 | 48 | 40 | 2 |
| 111 | 31 | 31 | 30 | 0 |
| 112 | 34 | 27 | 25 | 7 |
| 113 | 36 | 26 | 23 | 10 |
| 114 | 32 | 31 | 24 | 1 |
| 115 | 11 | 11 | 8 | 0 |
| 116 | 19 | 10 | 8 | 9 |
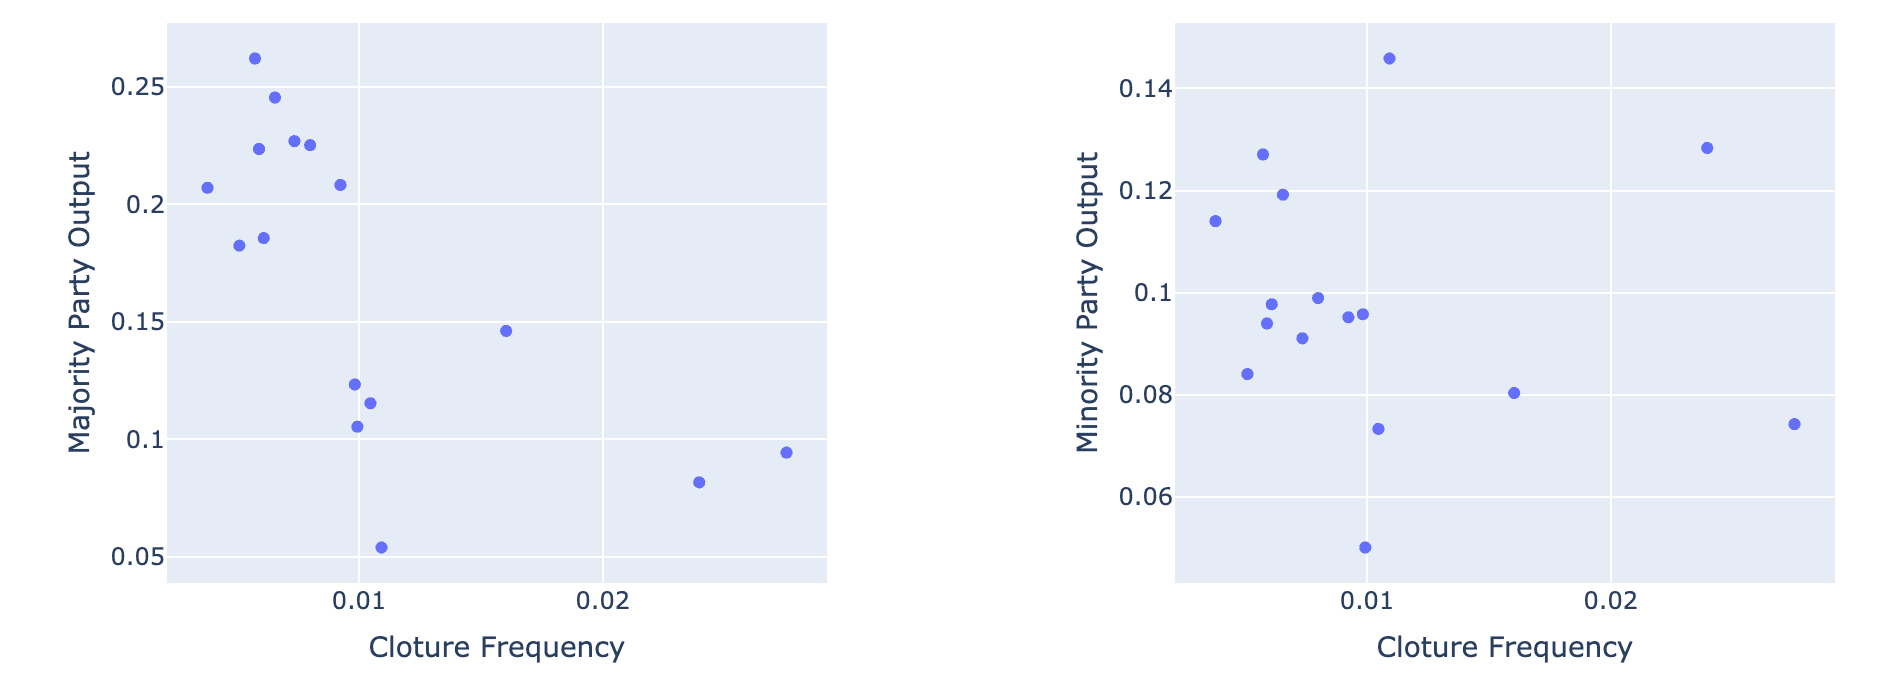
Further, we see from the scatterplots and table below that the relationship between cloture frequency and the legislative output of the majority party (i.e., the proportion of majority party bills that receive a floor vote) mimics that of cloture frequency and overall Senate output, whereas there is no evidence of a relationship between cloture frequency and minority party output. This suggests that if filibuster prevalence does, in fact, give rise to implicit obstruction, the effect is felt more strongly by majority party legislation than by minority party legislation, and the resultant decrease in overall Senate output can largely, if not entirely, be attributed to a decrease in majority party output.
| R | p-value | ||
|---|---|---|---|
| Ln(Cloture Frequency) | Majority Party Output | -0.71 | 0.002 |
| Cloture Frequency | Minority Party Output | -0.1 | 0.709 |
Essentially, while the Senate at large is susceptible to filibuster use, the majority party tends to bear the brunt of its obstructing effects, both indirectly and directly at the hands of the minority party. In contrast to the filibuster's ostensible bipartisan influence, this asymmetry serves to highlight the partisan incentives that underlie obstruction. In particular, while the majority party may be pressured by the filibuster to satisfy the desires of the minority party, the minority party is incentivized not to cooperate with the majority party. Rather than supporting a conciliatory bill that cedes some of what the minority wants, killing the bill allows them to deny the opposition a legislative win and wait for an opportunity, namely when they become the majority party, to secure an even greater part of their legislative agenda. This strategy, like any other, is contingent on its electoral viability, and given the high degree of political polarization in both Congress and the nation at large in recent decades, it is not difficult to imagine supporters of the minority party approving of, or even demanding that, their senators adopt this "no compromise" approach to some pieces of legislation that go against their interests. What's more is that the legislators of the minority party can then use their opposition's inability to reach a compromise or accomplish their legislative goals, despite being the party in power, as part of their campaign strategy come the next election cycle. In essence, despite the minority naturally being motivated to take whatever legislative concessions they can get while not in power, incentives for obstruction abound, and it may behoove the minority party to balance these considerations by accepting only the most favorable and necessary concessions while discarding the rest.
With this incentive structure in mind, it stands to reason that the minority party has a motive to employ the filibuster primarily as a tool for blockage and the majority party has reason to believe that their more vulnerable pieces of legislation should be kept off the Senate floor, especially when filibuster prospects are high, which is consistent with our results regarding obstruction.
Regarding bipartisanship, the lack of evidence of a relationship with filibuster prevalence makes it tempting to conclude that only the filibuster's obstructing effects prevail. However, parts of the data may suggest otherwise, specifically with respect to bipartisan passage.
First, concerning bipartisan cosponsorship, the hypothesized effects simply not materializing is certainly a possibility. More specifically, it could be the case that senators actually do not take conciliatory measures in response to heightened filibuster prospects or direct filibuster use, or that when they do, the opposition is not receptive to these efforts (e.g., they refuse to endorse accommodating bills), thus leaving bipartisan cosponsorship largely consistent irrespective of filibuster prevalence. The latter scenario in particular isn't too difficult to imagine, given the minority party's partial motivation not to seek conciliations with or accept conciliations from the majority party.
As for bipartisan passage on the other hand, despite its non-association with filibuster prevalence, its near ubiquity during each Congress may be indicative of another potential effect of the filibuster that is more difficult to detect. Namely, it is possible that the mere existence of the filibuster imposes such a threat to legislation that bipartisan provisions are essentially a prerequisite for bill passage, rendering nearly all Senate-approved bills bipartisan regardless of filibuster prospects and without the need for direct filibuster use. Unfortunately, there is no way to thoroughly verify or refute this notion, as the filibuster has existed since long before the Congresses in question and filibuster-proof supermajorities are exceedingly rare. However, to gain some insight into the difference the filibuster's existence might be making, we can compare the Senate's bipartisan passage rates to those of the House of Representatives (which does not allow filibusters), excluding from the latter metric bills that originated in the Senate so as to not factor in bills influenced by the filibuster.
| Congress | Bipartisan Passage Rate (House-Originated and House-Approved) | Bipartisan Passage Rate (Senate-Approved) |
|---|---|---|
| 102 | 0.932 | 0.971 |
| 103 | 0.893 | 0.953 |
| 104 | 0.865 | 0.959 |
| 105 | 0.898 | 0.986 |
| 106 | 0.921 | 0.981 |
| 107 | 0.942 | 0.985 |
| 108 | 0.924 | 0.992 |
| 109 | 0.912 | 0.974 |
| 110 | 0.897 | 0.978 |
| 111 | 0.893 | 0.952 |
| 112 | 0.8 | 0.963 |
| 113 | 0.83 | 0.97 |
| 114 | 0.838 | 0.978 |
| 115 | 0.892 | 0.996 |
| 116 | 0.898 | 0.996 |
The rates for each chamber for the last 15 Congresses are shown in the table above. We see that, for every Congress, bipartisan passage is more common for Senate-approved bills, suggesting that it is generally easier for partisan bills to gain passage in the House than in the Senate and thereby providing grist for the notion that the existence of the filibuster exerts a bipartisan influence. House-approved bills are still largely bipartisan though, with at least 80% of them passing with bipartisan approval during each Congress. Therefore, regardless of the degree to which the filibuster contributes to these differences, it seems that other factors intrinsic to both chambers, such as the risk of moderate voter backlash in response to hyperpartisanship, help maintain a strong baseline of bipartisanship in Congress at large. This suggests that while the existence of the filibuster likely contributes to Senate bipartisanship, the latter is not wholly or even largely dependent on the former.
Our analysis does not tell the full story of the filibuster's effects, as there are still some veiled impacts on legislation that cannot be captured by the data. For instance, we can only consider legislative output with respect to introduced bills, but the filibuster may pose enough of a threat to legislators to prevent some pieces of legislation from being introduced in the first place. Moreover, all bills are not created equal, and the data cannot capture the significance of the legislation impacted by the filibuster, making the societal implications of its effects difficult to appraise.
Nonetheless, for those who view legislative efficiency itself as a virtue, the results of this analysis and the upward trend of filibuster use over time are likely causes for concern and may suggest that the nation has more to gain than lose from a reworking of the filibuster, or even its outright abolition. In such a case, it stands to reason that bipartisanship would suffer to some degree, as it would be easier for more partisan legislation to pass. It remains unclear exactly to what degree, but the prevalence of bipartisan passage in the House of Representatives suggests that such a change would not disrupt the bipartisan nature of the Senate. Meanwhile, a non-trivial increase in Senate output seems all but guaranteed as a result. This ultimately raises the question of whether and to what degree the nation is willing to sacrifice bipartisanship for legislative efficiency and vice-versa - a question which our analysis is unable to answer but has hopefully provided useful insight into.
The code used to conduct this analysis is available on GitHub.