- Published on
The Racial and Income-Based Disparities of Environmental Risk Factors
- Authors

- Name
- Kodi
- https://twitter.com
Note: The differences listed in each t-test table were computed as the mean value for the first demographic indicator(s) listed in the column name minus that of the second.
It has long been understood that low-income and minority communities tend to bear a disproportionate burden of environmental hazards in the United States. In particular, studies have demonstrated disparities in things like air pollution, toxic waste sites, and industrial development between these communities and their whiter, more affluent counterparts. These discrepancies are in part attributed to the latter typically having both the political will and means to oppose environmentally hazardous development in their areas by means of lobbying and/or litigation. As a result, municipalities and industries instead target lower income areas for these projects, where people are in too dire of financial straits to file legal claims against the imposing entities or to be overly concerned about post-materialist issues like environmental health in the first place. The disparities can also be explained by redlining, the discriminatory lending practices and housing-related policies of the mid-1900s that excluded people of color from newly developing suburban communities, which resulted in minority communities tending to be in more urban areas with greater proximity to industrial activity and therefore greater susceptibility to its attendant environmental risks.
In an effort to provide further insight into such disparities, the EPA released an environmental justice screening tool that provides data for 220,333 communities throughout the U.S. across six demographic indicators, including percentages of people of color and low-income people, and the following 12 environmental indicators, as described and measured by the EPA:
Air toxics cancer risk - Lifetime cancer risk from inhalation of air toxics
Air toxics respiratory hazard index - Ratio of exposure concentration to health-based reference concentration
Diesel particulate matter - Diesel particulate matter level in air, in micrograms per meters cubed
Particulate matter (PM) 2.5 - Annual average in air, in micrograms per meters cubed
Ozone - Summer seasonal average of daily maximum 8-hour concentration in air, in parts per billion
Traffic proximity and volume - Count of vehicles (average annual daily traffic) at major roads within 500 meters, divided by distance in meters
Potential lead paint exposure - Percent of housing units built pre-1960
Risk Management Plan (RMP) site proximity - Count of RMP (potential chemical accident management plan) facilities within 5 kilometers (or nearest one beyond 5 kilometers), each divided by distance in kilometers
Hazardous waste proximity - Count of hazardous waste facilities within 5 kilometers (or nearest one beyond 5 kilometers), each divided by distance in kilometers
National Priorities List (NPL) site proximity - Count of proposed or listed NPL sites within 5 kilometers (or nearest one beyond 5 kilometers), each divided by distance in kilometers
Wastewater discharge - Toxic concentrations at stream segments within 500 meters, divided by distance in kilometers
Underground storage tanks - Count of leaking underground storage tanks (multiplied by a factor of 7.7) and the number of underground storage tanks within a 1500-foot buffered block group
Using the 2021 release of this data, we determined to what degree and for which environmental risk factors these racial and income-based disparities currently exist. We also investigated whether these demographic disparities exist independently of each other, which is not a foregone conclusion given the close relationship between race and income in the U.S., and to what degree the discrepancies of one outweigh those of the other.
To begin this analysis, we divided the communities into two sets of groups according to race and income level respectively (i.e., majority people-of-color vs. majority white and majority low-income vs. majority middle/high-income). Within each set, we then conducted a series of Welch's t-tests to determine the difference in mean values of each environmental indicator between the two groups and whether the difference is statistically significant, the results of which are displayed below.
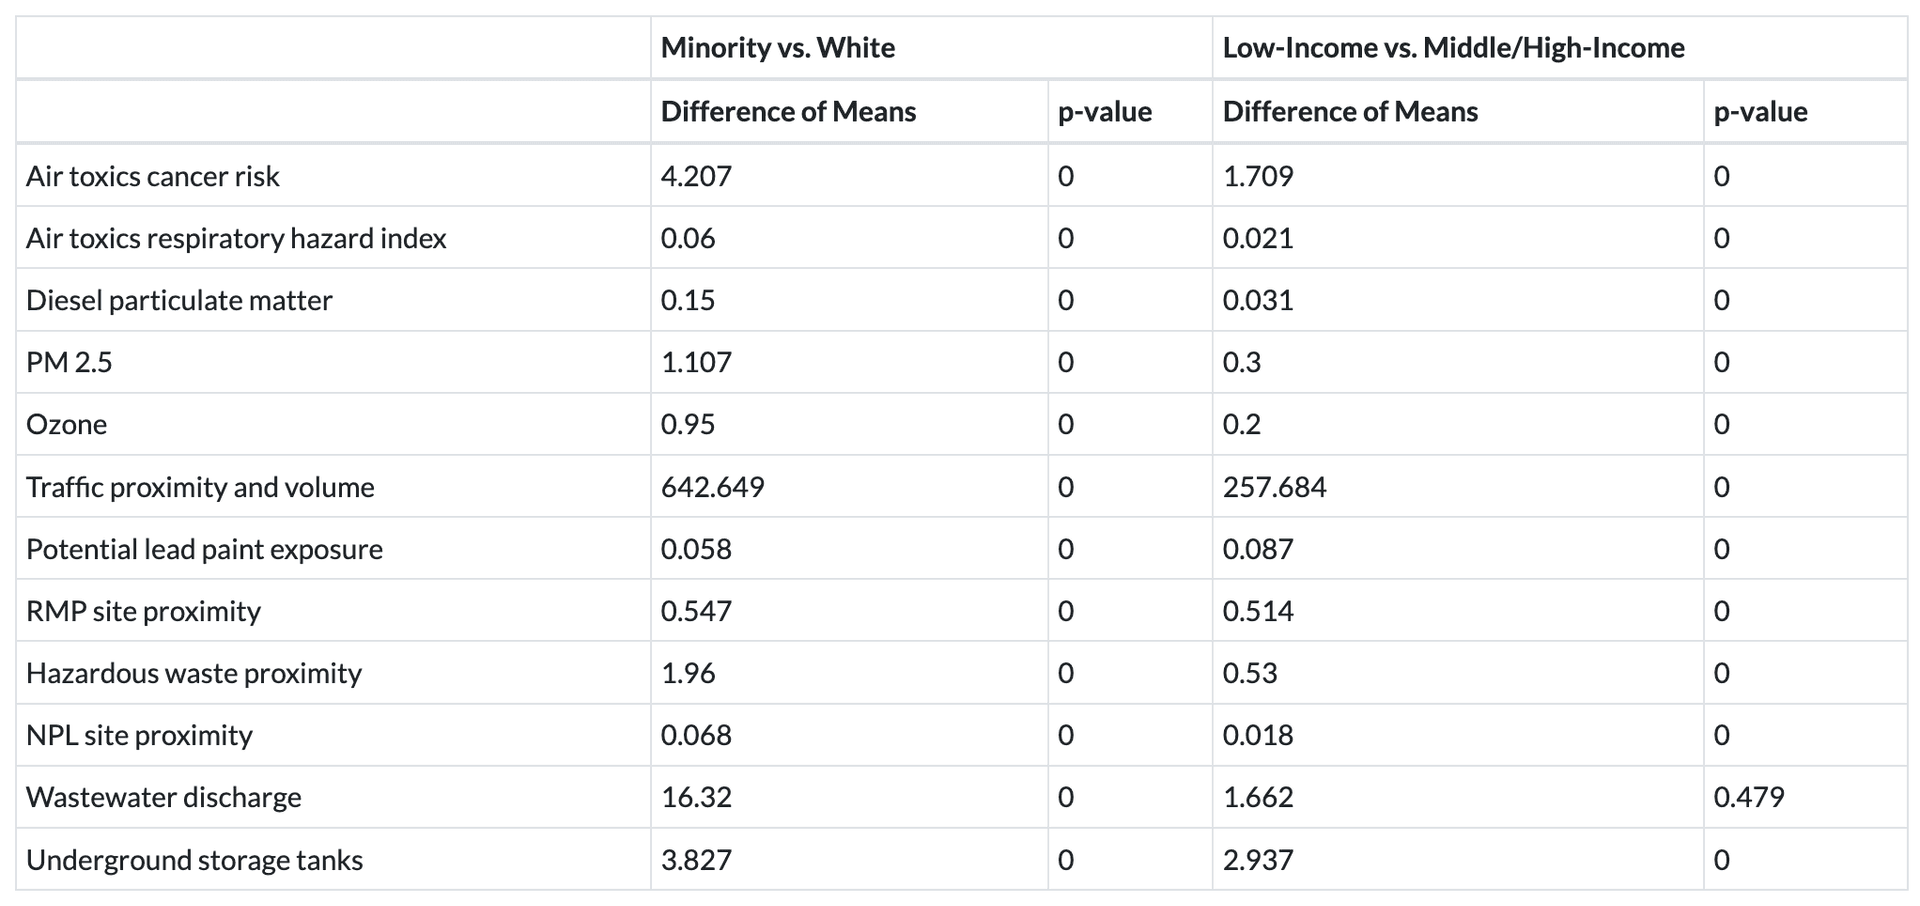
From the t-tests we find that the mean values of all environmental risk factors are greater for communities of color than they are for majority white communities, and using a significance level of 0.05, the differences are all statistically significant, which implies that minority communities generally suffer more from environmental hazards than their white counterparts. Similarly, compared to middle/high-income communities, low-income communities tend to be more greatly afflicted by these environmental risks, with only one environmental indicator (wastewater discharge) showing no statistically significant difference. We also see that, for every indicator except lead paint exposure, the differences are more pronounced between the racial groups than between the communities separated by income. Essentially, this corroborates the received wisdom that communities of color and low-income communities bear the brunt of environmental hazards, while suggesting that race might generally be a stronger predictor of the environmental circumstances of a community than income level is.
To further investigate the latter notion, we also determined how the minority and income-level percentages relate to each environmental indicator by computing the Pearson correlation coefficients between the demographic and environmental indicators, which gives the following table:

From the results above, we see that minority percentage has statistically significant, positive linear relationships with every indicator, while the percentage of low-income people has similar relationships with every indicator except for ozone levels and wastewater discharge. Therefore, with regard to nearly all of the environmental indicators, higher percentages of people-of-color and low-income people in a community are associated with greater environmental risk. Further, with the exception of lead paint exposure, each indicator correlates more strongly with race than it does with income-level, suggesting that while both demographic indicators are predictive of environmental hazards, the environmental circumstances of a community tend to be more closely tied to racial makeup than they are to income level.
With this in mind, it stands to reason that the discrepancies found above may be more traceable to race than they are to income. To confirm this, we again divided the communities, now into four sets of groups, with each set stratified by both race and income (i.e., low-income minority vs. low-income white, low-income minority vs. middle/high-income minority, etc.), and ran another series of t-tests. This gives the following table, revealing how the disparities change when controlling for the common demographic in each set:

Above, we see that regardless of the income level of the communities, white communities still fare better with regard to every environmental indicator except wastewater discharge, for which there is no statistically significant difference between low-income minority communities and low-income white communities. Interestingly, when instead controlling for racial makeup, we find that middle/high-income communities of color are actually slightly worse off than low-income communities of color, who fare better with regard to eight of the 12 indicators. Meanwhile, middle/high-income white communities fare better than low-income white communities with regard to five indicators and worse with regard to four. In addition, for nearly all of the indicators showing a disadvantage for the minority or low-income group, the difference in mean values is greater between the communities that differ by race than the communities differing in income. As a result, it seems that environmental disparities exist both more consistently and to a greater degree on racial lines than they do on income-based lines.
In essence, we see that communities of color and low-income communities indeed tend to suffer more from environmental hazards than their whiter and more affluent counterparts, with the race-based disparities proving more pervasive than those based on income. In particular, the racial disparities are greater and they persist regardless of income level, whereas many of the income-based disparities are nullified or reversed when controlling for race. Additionally, the overall prevalence of environmental risk factors in a community seems to be more closely tied to race than to income. This suggests that, if the nation's goal is to level the environmental playing field, the consideration of either of these demographic factors would likely prove effective at mitigating disparities, but a mostly race-focused policy approach may be preferable over one that primarily considers income level.
The code used to conduct this analysis is available on GitHub.